
Dave Ramsey built an empire in part by telling people to pay off their homes in fifteen years. It’s become gospel in certain circles. For Dave, it made sense. He was crushed by debt early in his career, nearly lost everything, and swore he’d never be that vulnerable again. That’s understandable.
But it’s also probably not your situation. Unfortunately Dave’s advice is optimized for Dave’s psychology, not necessarily for you or your finances. Dave needed the psychological win of being debt-free. But his bias could easily be costing you millions.
Understanding the opportunity cost
Say you locked in a $1,000,000 30-year fixed-rate mortgage at 3% (back when rates made that possible). The monthly payment on the mortgage is $4,216.04.
But Dave says to pay that mortgage off in fifteen years. To do so, you increase your monthly mortgage payment to $6,905.82. That’s an additional $2,690 a month.
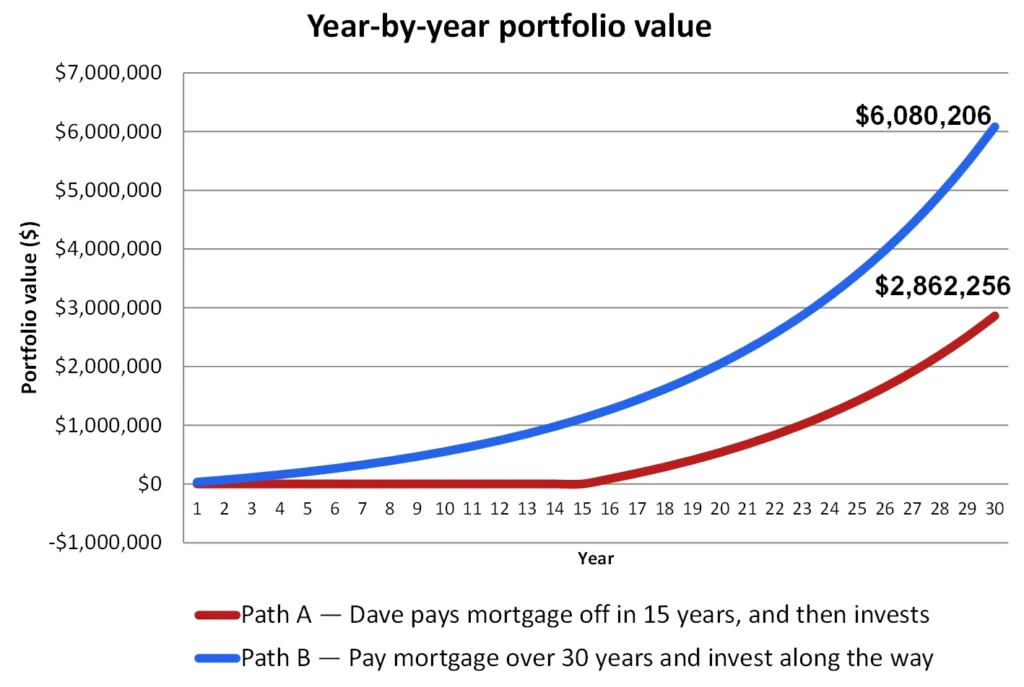
The math of Dave’s way: you pay $6,905.82 a month and invest $0 until the end of year 15, when the house is fully paid off. At that point you funnel all of that money — the $6,905.82 — into investing through year 30.
The JD Investor’s way: you pay $4,216.04 a month, and instead of plowing the additional $2,690 a month into the mortgage, you invest it and earn a 10% compounding annual return. You do this through year 30.
Here’s the result:
See footnotes below for source and methodology
If you follow Dave’s path and pay off that million-dollar mortgage in fifteen years instead of letting it ride for thirty, using our assumptions you’d be more than $3 million poorer.
To be sure, the math assumes you can stomach a market that doesn’t move in a straight line. Ten percent is the long-run average, and certainly not a guarantee. If you’d panic-sell during a 2008-style or Covid like drawdown, the analytical case falls apart, you wouldn’t actually capture those returns.
Why paying off a house might still make sense
Here’s the nuance: for some lawyers, paying off the house in fifteen years — or even in cash — makes sense. Maybe you hate leverage as much as Dave. Maybe your income is volatile. Maybe you genuinely sleep better without debt. That’s valid.
The point is: you should choose that path based on the numbers, not because Dave said so.
I own a house with a 2.5% mortgage. I would love to own it free and clear. But my analytical mind won’t let me pay it off. At 56 years old, I expect to carry that mortgage for another 20 years. My thinking is that I would prefer to play the odds to be be meaningfully more wealthy – wealthy enough to afford a small mortgage – as opposed to being slightly less wealthy, with no mortgage.
Maybe your bias is different. But whatever you choose, make it based on the numbers, not on Dave’s trauma.
Run your own numbers
Wonder what this analysis looks like in your specific situation? We built a calculator so you can run the numbers your self. Just include your mortgage balance, your rate, your expected market return. See what it actually costs you. Then decide.
Mortgage Opportunity Cost Calculator
Footnote on methodology. Both paths assume the same monthly cash outlay sustained for thirty years. In Path A (Dave's way), the entire outlay is directed to the mortgage for fifteen years; once the house is paid off, the same dollar amount is redirected into investments for the remaining fifteen years. In Path B (the JD Investor's way), the borrower makes the standard thirty-year mortgage payment and invests the monthly difference for the full thirty years. Wealth is compared at year thirty, when both paths own the house outright.
Monthly mortgage payments use the standard fixed-rate amortization formula. Investment values are computed as the future value of an ordinary annuity, with monthly contributions compounded at one-twelfth the annual return. The model assumes constant returns and ignores taxes (including the mortgage interest deduction and capital gains treatment on the investment side), investment fees, inflation, market volatility, sequence-of-returns risk, and personal circumstances — all of which may materially affect results. Any single year of investing can, and will, deviate substantially from the long-run average; this comparison reflects long-run averages, not guarantees.
This calculator is provided for informational and educational purposes only and is based on the assumptions and inputs you provide. The results are hypothetical, do not reflect actual investment performance, and are not guarantees of future outcomes. They should not be considered personalized investment advice or a recommendation. Consult a qualified financial professional before making any financial decisions.