
Here we go again. Record high heat waves. Record high house prices. Record highs in the stock market. Lots of “record highs.”
When you hear these headlines, you naturally think this is newsworthy. There’s something anomalous going on. Something extraordinary, which merits making note of because it is clearly something so rare.
If we’re talking about something which you would otherwise expect a normal “baseline” level, speaking of a “record high” makes sense.
If Stephen Curry has made more than 3700 3-point field goals, which is nearly 800 more than the next couple guys on the list (Ray Allen and James Harden), that’s really something.
But if we’re talking about things that have exhibited – over the long term – a natural and relatively consistent upward trajectory over time? It’s not nearly as newsworthy.
Why? Because a “record high” doesn’t mean as much if the thing you’re measuring is constantly growing
When the doctor measures your 3-year old’s height as being 38 inches, would you ever hear the following: “Your 3-year has reached a record high height! They’ve never been this tall before!”
That doesn’t make sense. Kids get taller over time. It’s not really news.
What about the stock market?
The stock market is a bit like the increase in a child’s height over time: over the long-term, the market has gone up.
Sure, the market doesn’t go up every day, or even every year. But if you look at the historical statistics, if you go back as far as the beginning of 1928, the odds of the market being up in any particular day has been 52.4%.
String all those dates together, and do the math (52.4% chance one day, followed by a 52.4% chance the next day, followed by a 52.4% chance the next, etc.) and it explains why the stock market has – over time – continued to consistently deliver record highs.
Below is a chart showing the S&P 500’s performance since 1980 (when the S&P 500 “record high” was 140) through June 20, 2024 (when it closed at 5,460). Superimposed on the line are the blue lines which indicate the number of record highs that occurred in each of the years.
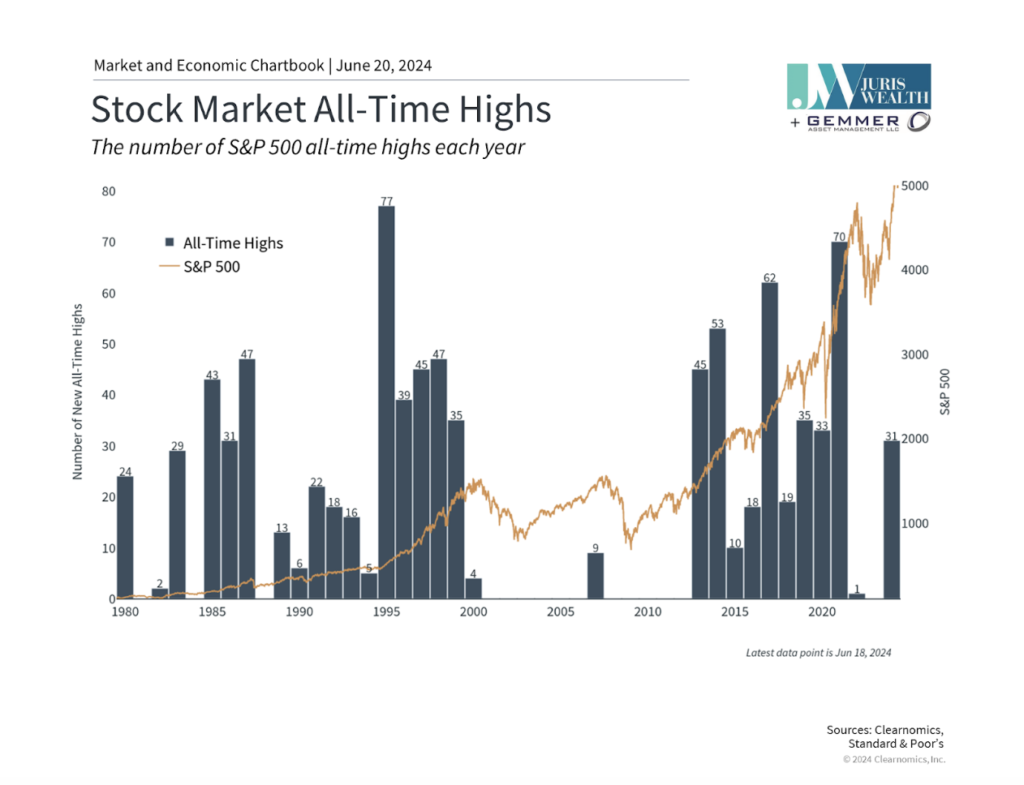
As the S&P 500 has gone up over 39x in that period of time, we’ve seen a total of 1,004 record highs.
The market can be volatile, but with a historical upward trend, mathematically, this is what you’d expect. If you are a long-term investor, and if history is any guide, you’re going to see a lot more “record highs” in the future.
(1) As of June 25, 2024. Sources: Bloomberg, internal calculations, Clearonomics,com, https://dqydj.com/sp-500-return-calculator/. This is where I should include the obligatory “past performance is not a guarantee of future returns” and “all investing involves risk of loss.” If you were an investor in 2001 and decided to throw in the towel after a couple of years of watching the market effectively flatline, you would have lost money. Stock investing is a long-term game. We have good reason to expect positive stock market returns going forward, driven by earnings growth, inflation, productivity growth, etc. But that’s the subject for another blog post.