What does your dollar buy you?
It depends. Are you spending it today or sometime in the future?
If you’re not spending your dollar today, you’ve got a problem on your hands.
With a positive inflation rate, your dollar is going to buy you less in the future, maybe a lot less.
Just as investments can compound in value over time, the impact of inflation compounds over time as well. In a very big way.
How big?
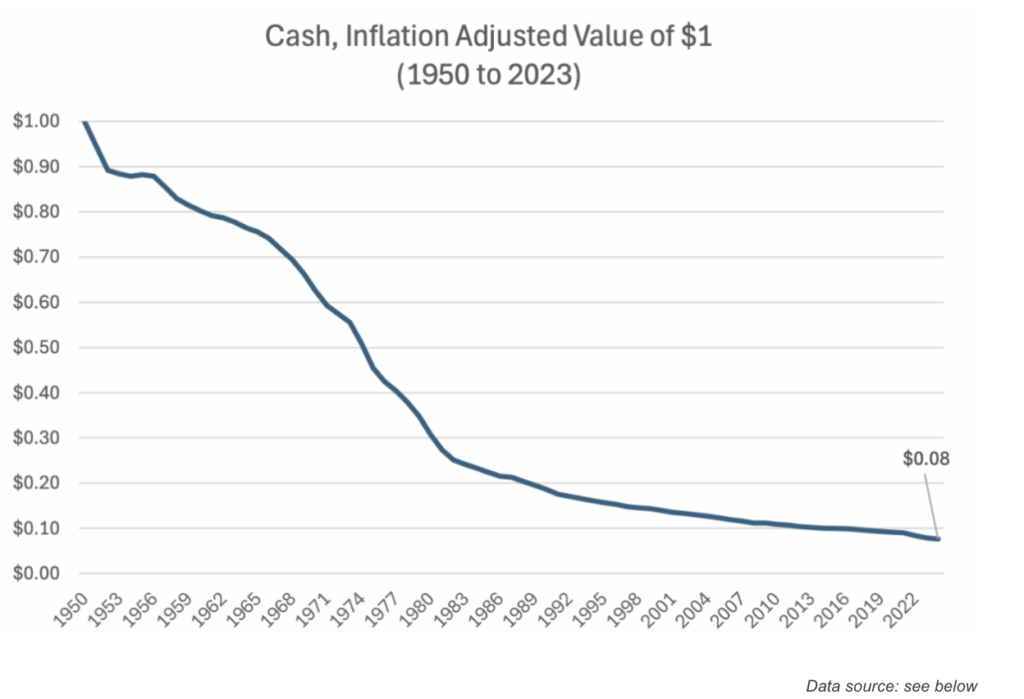
The chart below shows the inflation-adjusted value of $1 in cash from 1950 to 2023.
This shouldn’t be a surprise.
In 1950, the average new-car price in 1950 was $2,210.
In 2024, the average new-car price was over $48,000.
You simply get a lot less for your $1 today than you did in 1950.
Understanding this risk, suppose you invested your cash.
But not wanting to take a lot of risk, you put it in one of the safest investments possible: a very short term Federal Govt’ debt. Specifically, in a 3-month U.S. Government T-Bill.
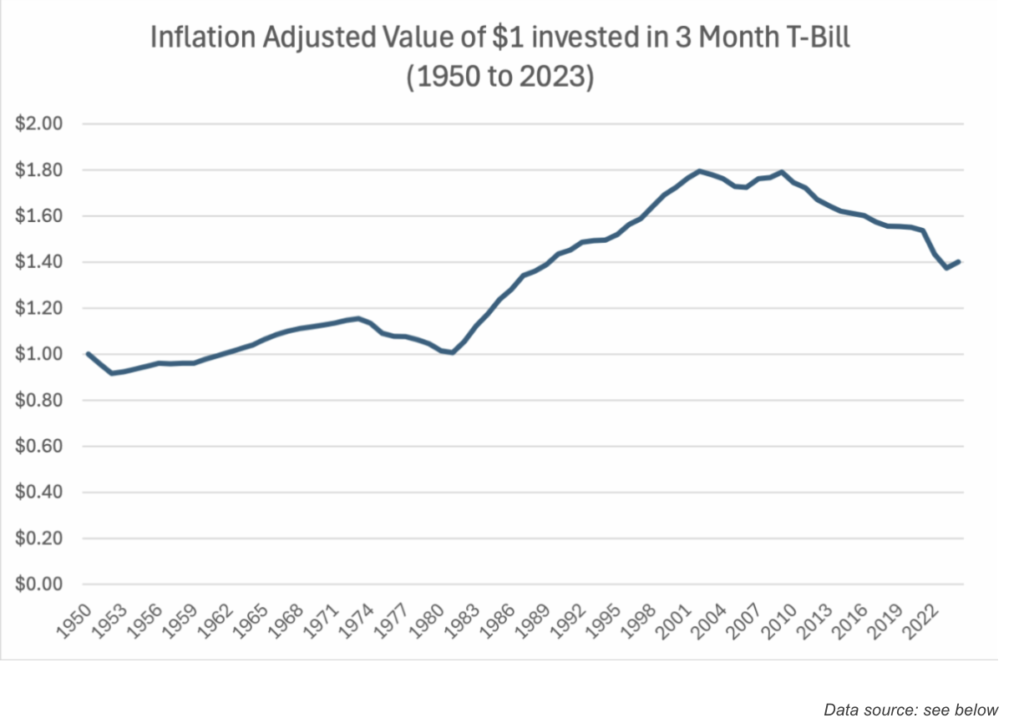
Here’s what that $1 (invested in 3-month T-Bills instead of being held in cash) buys you over time:
Ah, now we’re getting some protection from inflation!
The value of our dollar has actually grown over time (you’ve more than kept up with inflation!)
By 2023, the purchasing power value of your dollar – invested in 3- month T-Bills – has grown by nearly 40%, to $1.40.
Suppose you decided to be a little more adventurous and you were able to put your money into 10-year treasury notes?
(It’s a little more adventurous because the longer dated your bond portfolio, the more the value of your bond will change as interest rates move around.)
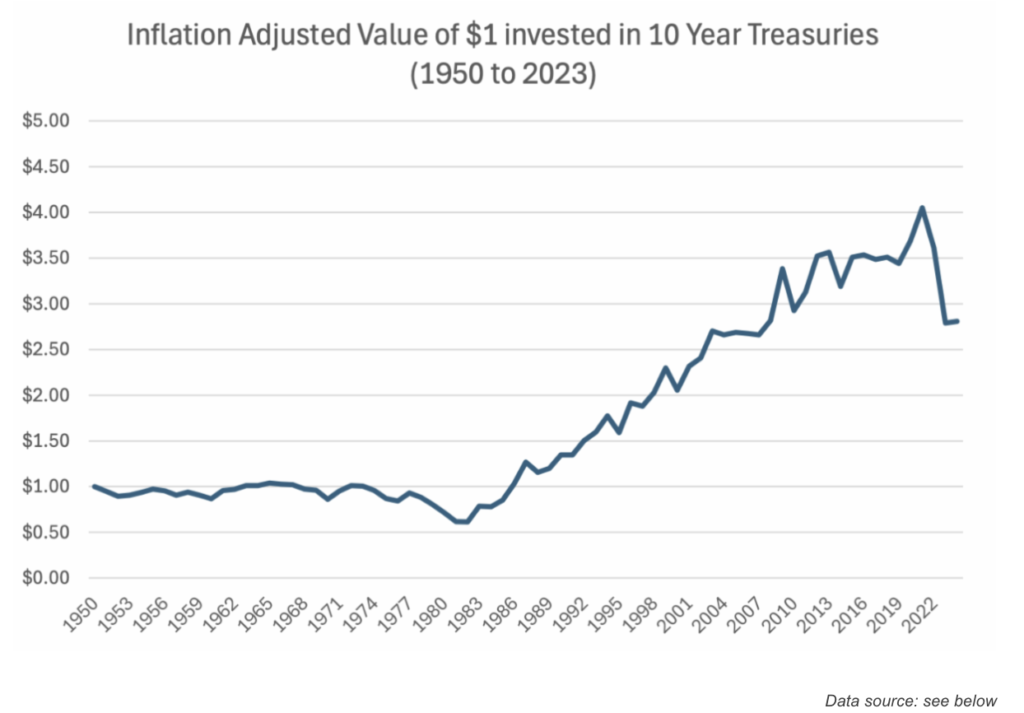
Now we’re cooking with gas… right?
You’ve protected the purchasing power of your dollar, and then some. Your $1 earned in 1950 will buy what costs nearly $3 today!
You know where I’m going with this, right?
What if you felt even more adventurous, and put your $1 into the stock market? What does that $1 buy you over time?
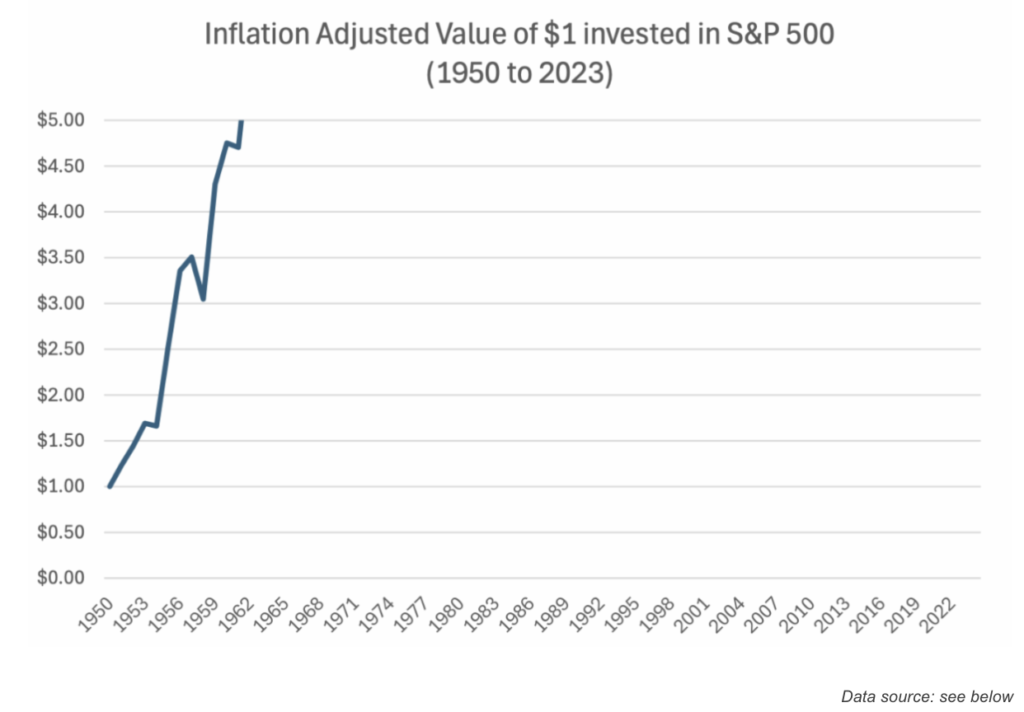
Oh wait, by the time we get to 1961, we’re off the scale of the previous chart.
The post-war bull market of the 1950s means the inflation adjusted value of your invested dollar had already grown by more than 5x within a decade.
Let’s change the scale of the chart, to $20.

We’re still off the scale of the chart.
What if we adjusted the scale to $40? Meaning the inflation-adjusted value of your $1 invested has grown over forty times. That’s a lot of inflation protection, right?
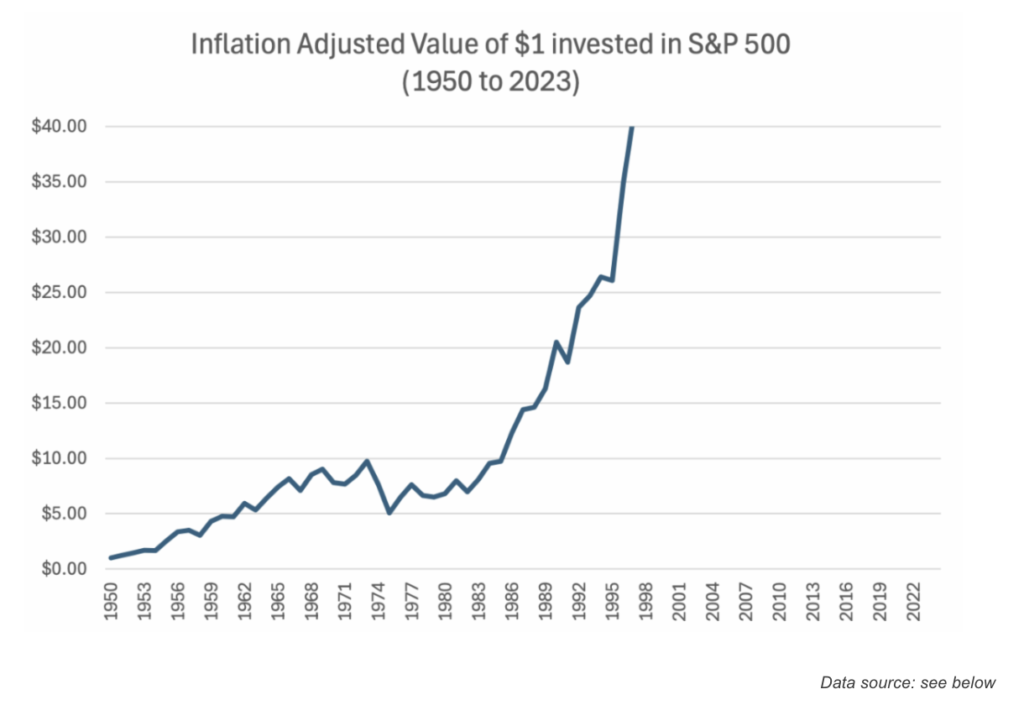
Nope. The stock market would have grown your $1 – even after taking into account inflation – to well over $40!
Get the point? Here’s the final chart. Believe it or not, that $1 invested in 1950 is worth over two-hundred times as much – even after we factor in the impact of inflation on the purchasing power of your dollar!
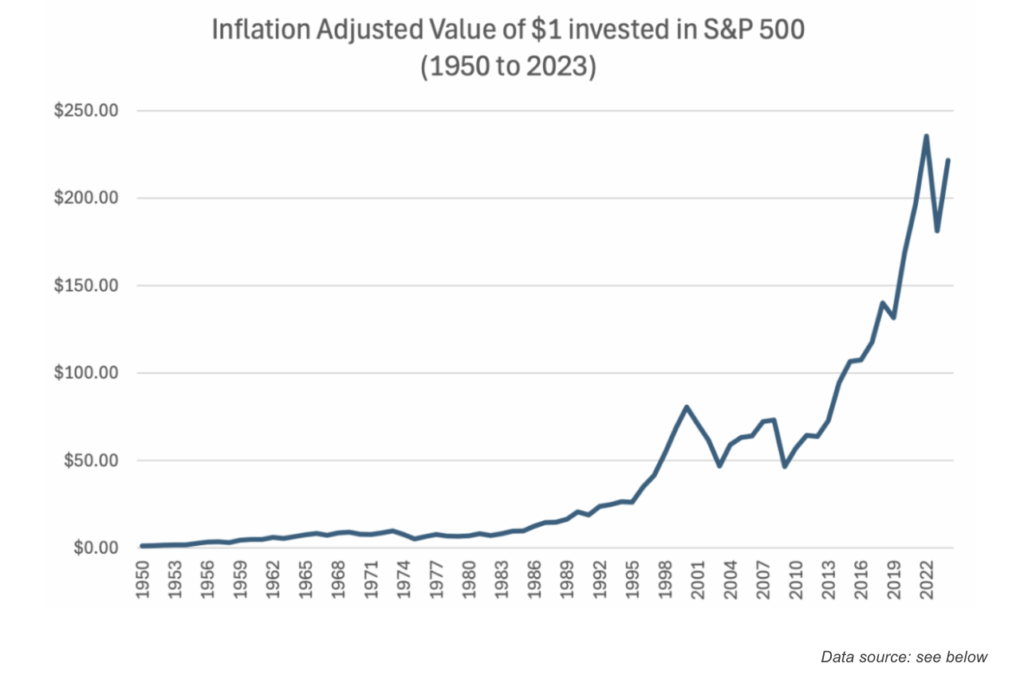
The take-away? Over the long-term, stocks have been an unbelievable means to protect the purchasing power of your money.
Yes, stocks are volatile and in shorter time frames you should not expect a stock market investment to keep pace, lock-step with inflation. Just about every bear market of the last century is proof stocks can go down even when the overall inflation rate is meaningfully higher.
But if you’re playing the long-game (and aren’t we all playing the long-game…?) the historical evidence is overwhelming: if you’re concerned about inflation, stocks have proven to be an extraordinary means to protect the purchasing power of your money over time.
Methodology and data sources: The value of $1 in cash over time is calculated by discounting the purchasing power of $1 in each calendar year by the compound impact of cumulative inflation rates through such time (yielding an “inflation discount rate”). The impact of inflation to dollars invested is based on the total value of the investments illustrated, discounted by the inflation discount rate. Return and inflation data from NYU stern. The S&P 500 numbers assume you reinvest your dividends. We’re ignoring all costs and taxes in this example. The cost of a car in 1950 comes from here and the cost of a car in 2024 comes from here.

