I spend a lot of time with clients who are nervous about the market. Nervous that the market has gone up a lot and is now too expensive. Nervous that it’s going down and will likely fall further.
The unfortunate truth is that nobody can predict what the market is going to do tomorrow, or next month, or next year.
Yet even acknowledging that we have no real ability to predict markets, if history is any guide, there does seem to be one reliable way of improving your investment odds.
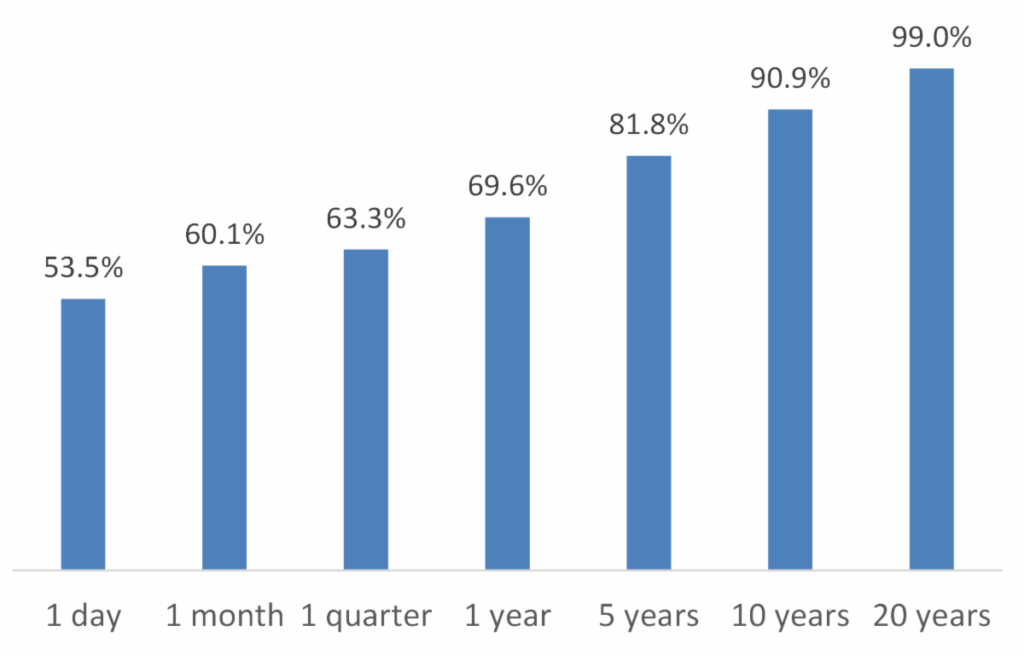
Historical odds of the market being up over different time frames
(January 1930 through June 2024)

The chart above was created by looking at the SP 500 closing market value every day from January 2, 1930 through June 30, 2024. That’s nearly 24,000 trading days. We calculated the odds of the market being up or down over various periods of time. Specifically, over (a) one day, (b) one month, (c) one quarter, (d) one year, (e) five years, (f) 10 years and (g) 20 years. Note that this analysis excludes the impact of dividends on an investment, a material source of returns for investors. Even still, the conclusion is clear:
Want to improve your investment odds? Just stay invested for longer!
Source: Bloomberg, internal calculations. Excludes dividends. 1 month return based on 20 trading days. 1 quarter return based on 63 trading days. 1-year return based on 252 trading days. 5 year returns based on 1260 trading days. 10 years based on 2520 trading days. 20 years based on 5040 trading days. Past performance is not a guarantee of future results.


