
Some of my clients have recently asked if I think the stock market is overvalued. (The US stock market, that is. We maintain material allocations to international equities, where valuation concerns are less pronounced.)
We have a view on this and will share the analytics behind that view in other communications.
But perhaps more importantly, we’re confident and self-aware enough to know that ultimately, we don’t really know. Because nobody does.
And that’s fine. Because when you invest in equities, you might think about it as investing in “The Package.”
Below is an illustration of The Package. (1)
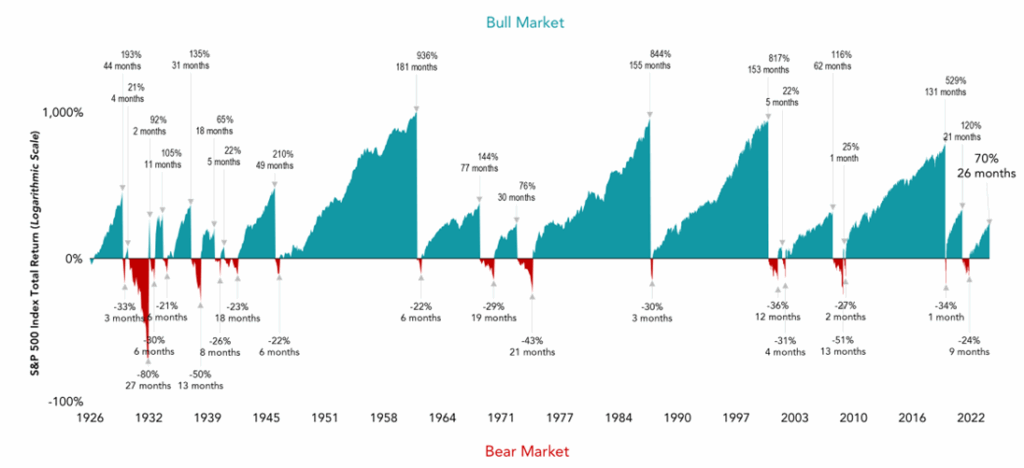
What you’re looking at is S&P 500 total returns from 1926 through the end of 2024.
The type is pretty small, but all you really need to know is that the teal areas represent bull markets, while the red areas represent the bear markets.
Notice how the teal areas are larger? The historical returns and duration of bull markets have greatly eclipsed those of the bear markets.
So we’ve been in a bull market. But are we going to see red soon?
Want the upside without the downside?
Too bad. You don’t get one without the other. That’s The Package. And The Package reflects to basic truths:
Truth Number One
Over The Long Term, Stock Market Investors Have Done Very Well
US equities have delivered a trendline return of around 10% per year, assuming dividends reinvested. (2) Going back half a century – from 1975 to 2025 – the S&P 500 compound annual return has been even stronger at 12% per year.
Meaning that a $10,000 investment in the S&P 500 in 1975 with dividends reinvested grew to $2,869,545. That’s a 288x return. (3)
This type of compounding wealth creation, available to anyone able to invest in the market is surely one of the world’s greatest economic miracles.
Truth Number Two
The Ride Is Bumpy And Sometimes Painful
Based on history, we might expect intra year declines from peak to trough of around 15%. Since 1980, the S&P 500 has shown an average intra-year decline of 14.2%. Note that’s not even a bear market. That’s just regular market volatility! (4)
When bear markets hit, they average a decline of about a third (34%). (5) Still, since that one third decline is an average, some declines are even steeper. The dot com crash saw the S&P 500 drop by just shy of 50% in October of 2002, and by 57% in March of 2009. (6) That is painful anyway you slice it.
That’s Just The Deal
So maybe the market is overvalued today, and poised for an imminent decline, even a crash. Again, we’ll share with you our analytical views in the near future. But you simply don’t get Part A without Part B. It’s a package.
You should be OK with that, however. Since all historical declines have proven to be temporary, and ultimately have been completely overwhelmed by the permanent advance of both values and dividends.
The economy cannot be consistently forecast, and the market cannot be consistently timed. The only way to ensure you are capturing equities’ premium returns is by staying invested through those declines.
For my clients with long-term plans in place – and that’s all of you – this volatility is exactly what you’re being compensated for accepting.
(1) Source: Dimensional Fund Advisors. S&P 500 Index total returns in USD, January 1926-December 2024 using a 20% threshold for downturns. Past performance is no guarantee of future results. Indices are not available for direct investment; therefore, their performance does not reflect the expenses associated with the management of an actual portfolio. In USD. Chart end date is 12/31/2024; the last peak to trough return of 70% represents the return through December 2024. Due to availability of data, monthly returns are used January 1926 through December 1987; daily returns are used January 1988 through present. Periods in which cumulative return from peak is −20% or lower and recovery of 20% from trough has not yet occurred are considered bear markets. Bull markets are subsequent periods following the bear market trough through the next recovery of at least 20%. The chart shows bear markets and bull markets; the number of months they lasted and the associated cumulative performance for each market period. Results for different time periods could differ from the results shown. Source: S&P data © 2025 S&P Dow Jones Indices LLC, a division of S&P Global.
(3) https://dqydj.com/sp-500-return-calculator/. Investing from December 1975 to December 2025.
(5) Schwab: How to invest in a bear market
Disclosures: Tim Corriero, an investment adviser representative (IAR) of Gemmer Asset Management LLC (“GAM”), conducts advisory services under the tradename Juris Wealth pursuant to GAM’s investment adviser registration with the U.S. Securities and Exchange Commission. Registration does not imply a certain level of skill or training. Juris Wealth offers comprehensive financial planning services to GAM’s clients at no additional cost. The JD Investor is a website/blog dedicated to educating and informing investors. Neither Juris Wealth, nor The JD Investor provides investment advisory services. For additional information, please refer to GAM’s Form CRS or visit adviserinfo.sec.gov for more information. The views expressed herein are those of Tim Corriero and do not necessarily reflect those of GAM. Investing in stock markets involves the risk of loss. Past performance is not a guarantee of future results. Information presented (including all charts, graphs, and statistics) is believed to be factual and up to date, but we do not guarantee its accuracy and it should not be regarded as a complete analysis of the subjects discussed. Information in these materials may change at any time and without notice. This material is not intended to provide, and should not be relied on for, tax, legal or accounting advice. You should consult your own tax, legal and accounting advisors before engaging in any transaction. GAM does not make any representations as to the accuracy, timeliness, suitability, completeness, or relevance of any information prepared by any unaffiliated third party incorporated herein, and takes no responsibility, therefore. All such information is provided for convenience purposes only and all users thereof should be guided accordingly. Any mention of a specific law firm herein does not constitute an endorsement, recommendation, or favoring by such firm.