
With a stark shift in US tariff policy announced on April 2 and ongoing responses worldwide, many investors are on edge. Volatility as measured by the VIX index has spiked to levels not seen in nearly five years. When there is real economic uncertainty and information is quickly changing, volatility is a sign that markets are functioning. The market’s job is to process uncertainty in real time. When trade policies change swiftly, markets are incorporating a vast amount of information and expectations about how these shifts may shape the global economy.
Current market prices reflect positive investor return expectations
Markets incorporate information and reflect it in asset pricing on a forward-looking basis, continuously incorporating new information and setting prices so that expected go-forward returns are always positive. (Said another way, investors expect to earn a profit.)
Consistent with this expectation, the chart below illustrates that market returns following downturns generally have been positive.
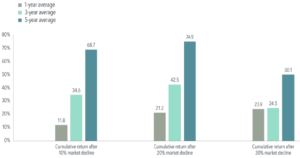
When we examine US equity returns following downturns of 10%, 20%, or even 30%, we see one-, three-, and five-year cumulative returns that are positive on average.
Viewed in annualized terms across five years, returns after a 20% decline have been close to the US market’s historical average of approximately 10%. (a)
Market gains can add up after big declines

“Market” based on the Fama/French Total US Market Research Index, reflecting cumulative returns, 7/1/26 to 12/31/2024. See “Chart and Data Source Disclosure” below for more details.
Obviously, there are no guarantees in investing. But if we’ve learned anything from the past, it’s that when your portfolio experiences a sudden drop, often the most important thing an investor can do is to stay invested and look forward to better days ahead.
(a) The average annualized return for the Fama/French Total US Market Research Index for the period July 1, 1926–December 31, 2024, was 10.23%, the average annualized returns for the five-year period after 10% declines were 9.59%; after 20% declines, 10.15%; and after 30% declines, 7.18%.
Chart and Data Source Disclosure: Dimensional Fund Advisors. In USD. The Fama/ French indices represent academic concepts that may be used in portfolio construction and are not available for direct investment or for use as a benchmark. Index returns are not representative of actual portfolios and do not reflect costs and fees associated with an actual investment. Total returns are calculated for the one-, three-, and five-year periods beginning the day after a downturn of 10%, 20%, or 30% from a new all-time high for the market. The bar chart shows the average total returns for the one-, three-, and five-year periods following the 10%, 20%, and 30% thresholds. For the 10% threshold, there are 30, 29, and 28 observations for the one-, three-, and five-year periods, respectively. For the 20% threshold, there are 16, 15, and 14 observations for the one-, three-, and five-year periods, respectively. For the 30% threshold, there are seven, seven, and six observations for one-, three-, and five-year periods, respectively. Eugene Fama and Ken French are members of the Board of Directors of the general partner of, and provide consulting services to, Dimensional Fund Advisors LP. Fama/French Total US Market Research Index: July 1926-present: Fama/French Total US Market Research Factor + One-Month US Treasury Bills. Source: Ken French website. Results shown during periods prior to each index’s inception date do not represent actual returns of the respective index. Other periods selected may have different results, including losses. Backtested index performance is hypothetical and is provided for informational purposes only to indicate historical performance had the index been calculated over the relevant time periods. Backtested performance results assume the reinvestment of dividends and capital gains. The Cboe Volatility Index, or VIX, is a real-time market index representing the market’s expectations for volatility over the coming 30 days.