
Stock returns are volatile, but nearly a century of bull and bear markets shows that the good times have outshone the bad.

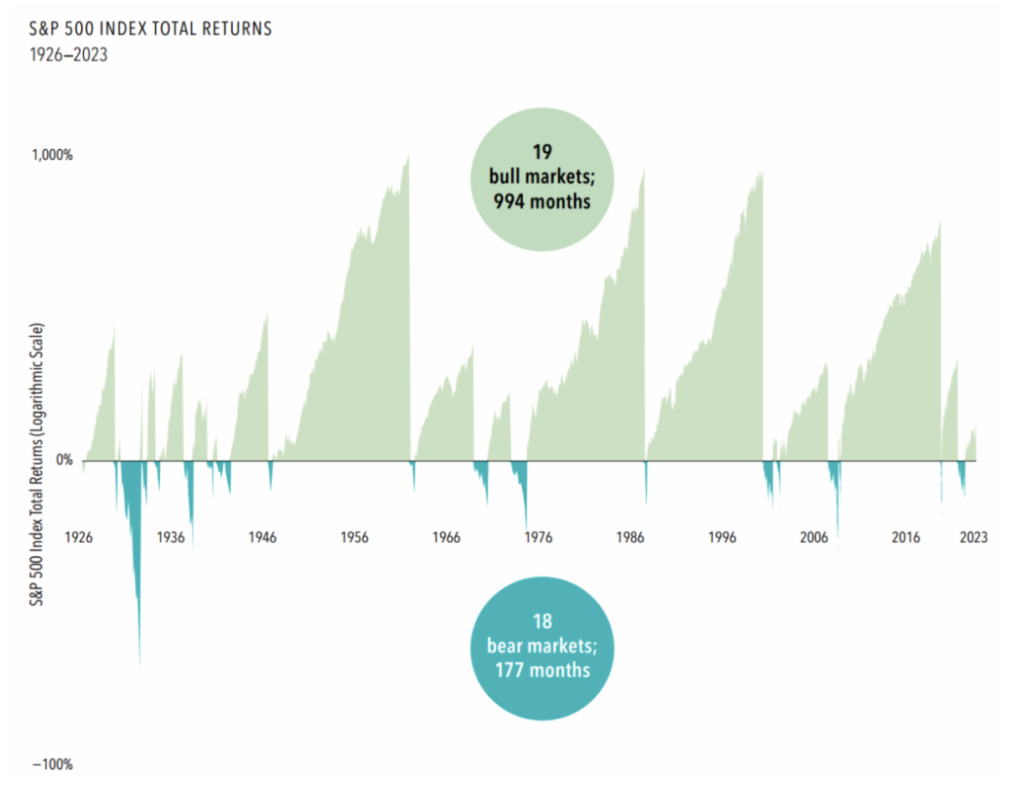
- From 1926 through 2023, the S&P 500 Index experienced 18 bear markets, or a fall of at least 20% from a previous peak, ranging from -21% to -80% across an average length of 10 months.
- On the upside, there were 19 bull markets, or gains of at least 20% from a previous trough. They averaged 52 months in length, and advances ranged from 21% to 936%.
- When bull and bear markets are viewed together, it’s clear equities have rewarded disciplined investors.
The stock market’s ups and downs are unpredictable, but history supports an expectation of positive returns over the long term
Past performance is no guarantee of future results. Indices are not available for direct investment. Their performance does not reflect the expenses associated with the management of an actual portfolio.
Source: Dimensional Fund Advisors. Chart disclosures: In USD. Chart end date is December 31, 2023; the last trough-to-end-of-period return of 36% represents the return through December 2023. Due to availability of data, monthly returns are used from January 1926 through December 1989; daily returns are used from January 1990 through the present. Periods in which the cumulative return from peak is –20% or lower, and a recovery of 20% from trough has not yet occurred, are considered bear markets. Bull markets are subsequent rises following the bear market trough through the next recovery of at least 20%. The chart shows bear markets and bull markets, the number of months they lasted, and the associated cumulative performance for each market period. Results for different time periods could differ from the results shown. A logarithmic scale is a nonlinear scale in which the numbers shown are a set distance along the axis and the increments are a power, or logarithm, of a base number. This allows data over a wide range of values to be displayed in a condensed way.